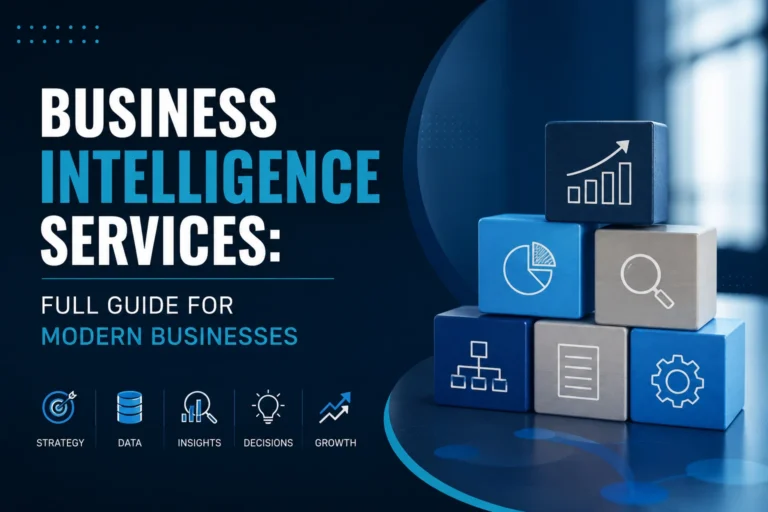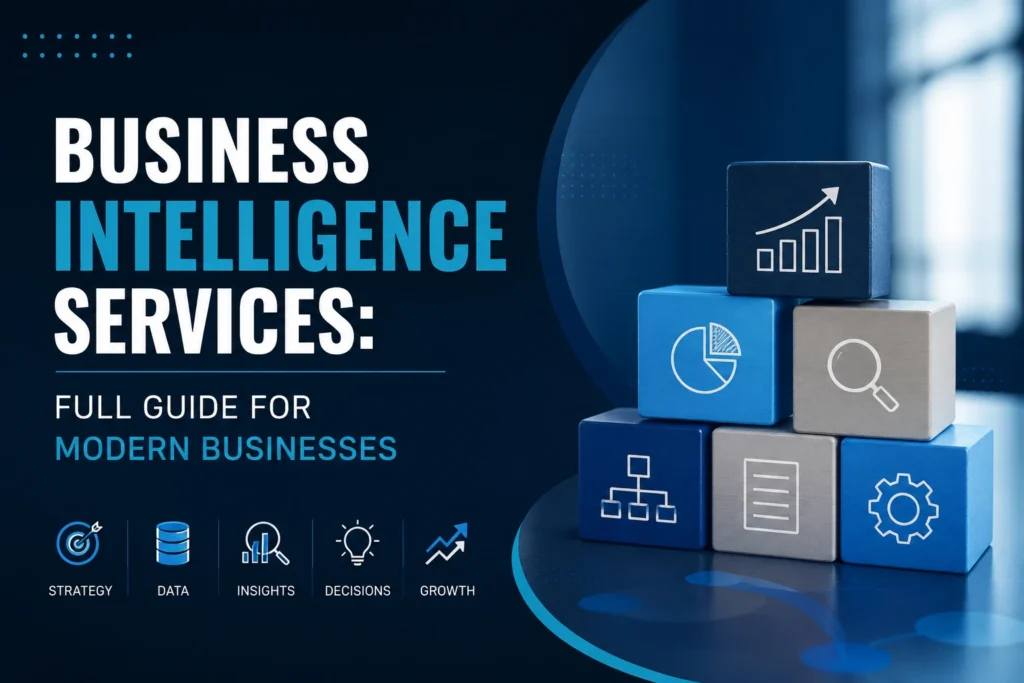

Business Intelligence Services: Full Guide for Modern Businesses
Businesses generate more data than ever, from sales and customer interactions to marketing campaigns, financial records, operations, and supply chains. The challenge is no longer simply collecting that data. It is understanding what the data means and using it to make better decisions.
That is where business intelligence services come in. BI services help organizations collect, integrate, analyze, and visualize business data so decision-makers can see performance clearly, identify trends, and uncover opportunities.
What Are Business Intelligence Services?
Business intelligence services are professional solutions that help businesses turn raw data into useful insights for decision-making. They can cover everything from BI consulting and data integration to data warehousing, analytics, dashboard development, reporting, and ongoing support.
Instead of relying on disconnected spreadsheets or assumptions, businesses can bring information from different systems into a more unified view. This may include data from CRM platforms, sales systems, financial software, marketing tools, inventory systems, websites, and other sources.
The goal is not simply to produce more reports. Effective BI helps people understand what is happening, why it may be happening, and where attention is needed. IBM describes business intelligence as a combination of processes and technologies used to collect, manage, and analyze organizational data to inform business strategy and operations.
For example, a sales team may use BI to monitor revenue, conversion rates, and pipeline performance. A marketing team can compare campaign results and customer acquisition trends, while finance teams can examine profitability and expenses. When these insights are presented through accessible dashboards and reports, teams can make decisions based on current business information rather than isolated data points.
How Do Business Intelligence Services Work?
A BI solution typically begins with data and ends with actionable business insight. Although the technology behind it can be complex, the overall process is straightforward: collect the right data, prepare it, analyze it, visualize the findings, and use them to guide decisions.
Data Collection
The first stage is identifying and collecting the data a business needs. Information may exist across multiple systems, including CRM and ERP platforms, databases, spreadsheets, cloud applications, websites, and external sources.
The quality and relevance of these sources matter. A dashboard built from incomplete or unreliable information can create a misleading picture of business performance. For that reason, BI projects normally begin by understanding where important data lives and how it is currently being used.
Data Integration and Preparation
Businesses often store related information in different systems. A customer may appear in a CRM, purchase records may sit in an e-commerce platform, and payment information may be maintained separately.
BI services connect these sources and prepare the data for analysis. This can involve cleaning inconsistent records, removing duplicates, standardizing formats, and establishing relationships between datasets.
This stage is important because useful analytics depends on trustworthy underlying data. A sophisticated dashboard cannot compensate for poor data quality.
Data Analysis
Once data is prepared, BI tools and analysts examine it to identify patterns, trends, relationships, and unusual results. The analysis can focus on historical performance, current activity, or specific business questions.
For example, a company might discover that revenue is increasing while profit margins are declining. That insight could lead management to investigate pricing, operating costs, customer acquisition costs, or product-level profitability.
Business intelligence is primarily concerned with understanding business performance through data, while more advanced business analytics can extend this work toward predictive and prescriptive analysis.
Data Visualization and Reporting
Raw tables can be difficult to interpret, especially when decision-makers need answers quickly. Data visualization converts complex information into charts, graphs, reports, and dashboards that make important patterns easier to recognize.
A well-designed BI dashboard can bring key metrics together in one place, allowing users to monitor performance without manually combining information from multiple reports. Microsoft describes dashboards as a way to view important metrics and business information at a glance through visualizations.
The best dashboards are not overloaded with every available metric. They focus on the information that helps a specific audience understand performance and take action.
Turning Insights Into Decisions
The final stage is where business intelligence creates practical value. Data only becomes useful when people can act on what it reveals.
A company may use BI insights to adjust marketing budgets, improve sales processes, identify operational inefficiencies, manage inventory, understand customers, or investigate changes in revenue.
In other words, the purpose of business intelligence is not to replace human judgment. It gives decision-makers better evidence to support that judgment.
🧠 Deepen Your Knowledge:: 7 Functions of Marketing: Guide, Examples & Importance
What Do Business Intelligence Services Include?
Business intelligence services can range from a focused dashboard project to a complete data and analytics environment. The exact scope depends on the organization’s size, objectives, existing infrastructure, and data maturity.
BI Consulting and Strategy
BI consulting helps a business determine what it should measure, which data it needs, how its existing systems should connect, and what type of BI solution fits its goals.
A strong strategy starts with business questions rather than technology. Instead of asking which tool to purchase first, organizations should identify the decisions they want to improve and the KPIs that can support them.
Data Warehousing
A data warehouse provides a centralized environment for storing and organizing business data for reporting and analysis. It can make information from different operational systems easier to access consistently.
For businesses dealing with growing volumes of information, a well-designed data architecture can provide a stronger foundation for analytics and reporting.
BI Dashboard Development
Dashboard development turns business requirements and prepared data into interactive visual interfaces. These dashboards can help executives, managers, sales teams, marketers, and other departments monitor the metrics relevant to their responsibilities.
A dashboard should answer important questions quickly without forcing users to search through unnecessary information.
Data Visualization and Reporting
BI services can also include customized reports and visualizations for recurring business needs. These may cover financial performance, sales, marketing, customer behavior, operations, or other areas.
The objective is simple: make important information easier to understand, compare, and act upon.
BI Implementation and Support
A BI project does not necessarily end when a dashboard goes live. Businesses may need help with deployment, user training, data refreshes, security, maintenance, troubleshooting, and future improvements.
This ongoing support helps ensure that the BI environment continues to reflect changing business requirements rather than becoming another outdated reporting system.
Key Benefits of Business Intelligence Services
The value of business intelligence goes beyond creating attractive dashboards. When data is connected, reliable, and easy to interpret, organizations can make faster decisions with greater confidence. BI services also help different departments work from the same information instead of relying on separate reports or assumptions.
Better Data-Driven Decision-Making
One of the biggest advantages of BI is giving decision-makers a clearer view of business performance. Instead of waiting for manually prepared reports, teams can access relevant metrics and use them to evaluate what is working and where attention is required.
This does not mean every decision should be based on a single metric. Rather, BI provides the evidence needed to understand a situation before choosing a course of action.
Improved Operational Efficiency
BI can reveal bottlenecks, inefficient processes, resource gaps, and areas where time or money is being wasted. For example, an operations team might identify recurring delays in a particular process and investigate the underlying cause.
Automated reporting can also reduce the amount of time employees spend collecting and preparing data manually, allowing them to focus more on analysis and business activities.
Faster Access to Business Insights
When information is spread across spreadsheets, databases, and different applications, answering a simple business question can take considerable time. A centralized BI environment can make relevant information easier to access and analyze.
This becomes particularly valuable when managers need to monitor changing sales, customer, financial, or operational conditions without waiting for a separate report to be prepared.
Better Forecasting and Planning
Historical and current data can help businesses identify trends that support future planning. BI can provide the foundation for forecasting revenue, demand, sales performance, inventory requirements, and other important business metrics.
More advanced analytics can take this further by using statistical and machine learning techniques to estimate potential future outcomes.
Stronger Competitive Advantage
Companies that understand their customers, operations, and market performance can often respond more effectively to changes. BI helps uncover patterns that may otherwise remain hidden in large datasets.
The advantage is not simply having more data than competitors. It is being able to turn relevant data into useful business insight and act on it at the right time.
Who Needs Business Intelligence Services?
Business intelligence is no longer limited to large enterprises with dedicated analytics departments. Organizations of different sizes can use BI when they have enough data and a clear business need for better reporting and analysis.
Small and Growing Businesses
Small businesses can use BI to understand sales, customer acquisition, expenses, website performance, and other important metrics. A focused BI solution can help owners replace scattered spreadsheets with a clearer view of performance.
Mid-Sized Companies
As companies grow, their data usually becomes more fragmented. Different teams may adopt different systems for sales, finance, marketing, and operations. BI services can connect these sources and create a more consistent reporting environment.
Large Enterprises
Large organizations often manage huge volumes of data across multiple departments, regions, products, and systems. Enterprise BI can provide centralized reporting while still allowing individual teams to analyze information relevant to their work.
Data-Driven Industries
Industries such as retail, SaaS, finance, manufacturing, healthcare, logistics, and e-commerce can benefit significantly from BI because they generate substantial operational and customer data.
The important question is not whether a business is large enough for BI. It is whether better use of its data can improve a meaningful business decision.
🧠 Deepen Your Knowledge:: How Business Directories Help Build Brand Awareness
Common Business Intelligence Use Cases
Business intelligence can be applied across almost every major business function. The metrics may differ from one department to another, but the underlying objective remains the same: transform business data into useful insight.
Sales Analytics
Sales teams can use BI to monitor revenue, conversion rates, sales pipelines, customer acquisition, and individual or regional performance.
A sales dashboard can make it easier to identify underperforming areas and understand where opportunities are developing.
Marketing Analytics
Marketing teams can connect campaign, website, advertising, and customer data to evaluate performance. BI can help organizations understand which channels generate results and how marketing activity contributes to business outcomes.
This is particularly useful when companies are managing multiple campaigns and channels simultaneously.
Financial Analytics
Finance teams can use BI to monitor revenue, expenses, margins, cash flow, budgets, and profitability. Instead of relying exclusively on periodic financial reports, decision-makers can gain a more detailed view of financial performance.
This can support budgeting, cost management, and strategic planning.
Customer Analytics
Customer data can reveal purchasing behavior, engagement patterns, retention trends, and customer segments. BI helps businesses turn these datasets into insights that can support better customer experiences and more informed marketing decisions.
Operations and Supply Chain Analytics
Operations teams can analyze productivity, inventory, delivery performance, resource utilization, and process efficiency. In supply chain environments, BI can help businesses monitor demand, stock levels, supplier performance, and potential disruptions.
Business Intelligence vs. Business Analytics
Business intelligence and business analytics are closely related, but they are not the same.
Business intelligence primarily focuses on understanding business performance through data. It commonly answers questions such as: What happened? What is happening now? Where are we performing well or poorly?
Business analytics takes the analysis further. Depending on the approach, it can explore why something happened, predict what may happen next, or recommend possible actions. IBM broadly distinguishes business analytics from BI by emphasizing the use of statistical analysis, data mining, predictive modeling, and related techniques to derive deeper insights from data.
In practice, the two disciplines often work together. A company might use BI to identify declining sales in a dashboard, then apply analytics to investigate the causes and forecast future performance.
Business Intelligence vs. Traditional Reporting
Traditional reporting typically presents predefined information at scheduled intervals. It can be useful for documenting performance, but it may require considerable manual work and may not provide enough flexibility for changing business questions.
Modern BI introduces a more interactive approach. Users can explore dashboards, filter information, compare different periods, and examine performance across various dimensions.
The difference is best understood as reporting information versus exploring information.
For example, a traditional report might show that monthly revenue was $500,000. A BI dashboard could allow a manager to examine that revenue by product, region, customer segment, sales representative, or time period.
That additional context can turn a simple number into a more meaningful business insight.
🧠 Deepen Your Knowledge:: MI Business Search
Popular Business Intelligence Tools and Platforms
Organizations can choose from a wide range of BI platforms, and the right option depends on their data environment, technical requirements, users, and budget.
Microsoft Power BI
Power BI provides interactive reporting and data visualization capabilities and is widely used for connecting data sources, creating dashboards, and sharing insights across organizations.
Tableau
Tableau focuses heavily on interactive data visualization and analytics, helping users explore data and communicate insights through visual interfaces.
Looker
Looker is Google’s business intelligence and analytics platform, designed to help organizations explore, model, and share insights from business data.
Other platforms, including Qlik and SAP BusinessObjects, serve different enterprise and analytics requirements. The best choice should be based on business needs rather than popularity alone.
How to Choose the Right Business Intelligence Services Provider
The right BI provider should understand both your technology environment and your business objectives. A technically advanced solution can still fail if it does not solve the problems that matter to your organization.
Define Your Business Goals
Start with the decisions you want to improve. You may need better visibility into sales, customer retention, profitability, marketing performance, inventory, or operational efficiency.
Clear objectives make it easier to determine which data, KPIs, dashboards, and integrations are actually necessary.
Evaluate Data and Technology Expertise
A provider should be comfortable working with your existing databases, cloud platforms, CRM, ERP, analytics tools, and other systems. Ask how they approach data integration, quality, security, and scalability.
The goal is to create a reliable BI environment rather than simply connect a few data sources to a dashboard.
Consider Industry Experience
Industry experience can shorten the learning curve because an experienced provider may already understand common KPIs, reporting requirements, and data challenges within your sector.
However, industry experience should support, not replace. A clear understanding of your specific business model.
Review Security and Scalability
Business intelligence environments often contain sensitive financial, customer, employee, or operational information. Data access controls, governance, privacy, and security should therefore be considered from the beginning.
The solution should also be capable of growing with the organization. Adding more users, data sources, locations, or reporting requirements should not require rebuilding the entire BI environment.
Look Beyond Implementation
A good provider should be able to support the solution after launch. Training, maintenance, troubleshooting, performance monitoring, and future development can all influence the long-term value of a BI investment.
🧠 Deepen Your Knowledge:: The 10-Point Checklist for Evaluating an IPO Advisor in India
How Much Do Business Intelligence Services Cost?
There is no universal price for business intelligence services because every project has different requirements.
A basic dashboard using a few clean data sources will typically require far less work than an enterprise BI environment involving multiple databases, complex integrations, advanced analytics, strict security requirements, and hundreds of users.
The overall cost can be influenced by the number and complexity of data sources, data preparation requirements, dashboard functionality, BI platform, user count, integrations, customization, cloud infrastructure, and ongoing support.
For this reason, businesses should avoid choosing a provider based solely on the lowest initial quote. A solution that appears inexpensive but requires significant rework later can become more costly than a properly planned implementation.
Business Intelligence Implementation Process
A successful BI implementation should follow a structured process. The exact methodology varies between providers, but most projects involve several core stages.
1. Assess Business and Data Requirements
The process begins by understanding business objectives, existing systems, available data, reporting challenges, and the people who will use the solution.
This stage establishes what the BI environment actually needs to accomplish.
2. Define KPIs and Reporting Requirements
The next step is identifying which metrics matter most. KPIs should connect directly to business objectives rather than being selected simply because the data is available.
For example, a sales dashboard might focus on revenue growth, conversion rate, average deal value, and pipeline performance instead of displaying dozens of unrelated metrics.
3. Build the Data Foundation
Data from relevant systems is integrated, cleaned, transformed, and organized for analysis. Depending on the organization’s architecture, this may involve databases, data warehouses, data lakes, or cloud-based data platforms.
Strong data foundations are essential because dashboards are only as reliable as the information behind them.
4. Develop and Test Dashboards
Once the data foundation is ready, dashboards and reports can be developed around specific user needs.
Testing should verify calculations, filters, data refreshes, permissions, and overall usability before the solution reaches a wider audience.
5. Deploy and Train Users
After validation, the BI solution can be deployed to its intended users. Training helps teams understand how to navigate dashboards, interpret metrics, and use insights in their daily decisions.
Adoption matters because even an excellent BI platform delivers limited value if employees do not use it.
6. Monitor and Improve
Business requirements change over time. New data sources appear, KPIs evolve, and teams discover new questions they want the BI environment to answer.
Continuous monitoring and optimization help keep the solution relevant as the organization grows.
Common Challenges of Business Intelligence
BI can create significant value, but implementation is not always straightforward. Poor data quality is one of the biggest obstacles. Inconsistent formats, duplicate records, missing information, and disconnected systems can undermine otherwise sophisticated analytics.
Data silos are another common challenge. When departments maintain separate systems and definitions, teams may disagree about basic numbers such as revenue, customers, or active accounts.
User adoption can also become a problem. If dashboards are complicated, slow, or disconnected from daily workflows, employees may return to spreadsheets and manual reporting.
Security and governance require attention as well. Businesses need appropriate controls around who can access specific information and how sensitive data is managed.
These challenges reinforce an important principle: successful BI is as much about data quality, people, and processes as it is about technology.
How AI Is Changing Business Intelligence Services
Artificial intelligence is making BI more accessible and increasingly interactive. Traditional dashboards require users to select filters, interpret charts, and understand predefined reports. AI can make it possible to interact with business data using natural language.
For example, instead of manually exploring several reports, a user could ask a system why sales declined last quarter and receive an analysis based on available business data.
AI can also support automated insights, anomaly detection, forecasting, natural-language summaries, and conversational analytics. Microsoft’s current Power BI capabilities, for example, include AI-assisted features designed to help users analyze and interact with business data.
However, AI does not eliminate the need for reliable data and sound governance. If the underlying information is incomplete, inconsistent, or poorly defined, AI-generated insights can also be misleading.
The future of BI is therefore not simply about adding AI to dashboards. It is about combining trusted data, analytics, automation, and human judgment to make business intelligence more useful and accessible.
What Is the Future of Business Intelligence?
BI is moving toward more automated, real-time, and user-friendly analytics. Cloud platforms are making data environments easier to scale, while self-service analytics allows more employees to explore information without depending entirely on technical teams.
AI and natural-language interfaces are also reducing the technical barrier between business users and their data. Instead of learning complex reporting tools, users can increasingly interact with information through simple questions.
At the same time, data governance will become more important. As organizations rely more heavily on automated and AI-assisted insights, they will need stronger processes for ensuring data accuracy, security, consistency, and responsible use.
The businesses that benefit most will not necessarily be those with the largest amount of data. They will be the ones that can turn reliable data into timely, understandable, and actionable decisions.
How to Get Started With Business Intelligence Services
Businesses do not need to transform their entire data environment on day one. A more practical approach is to start with a specific problem that has measurable business value.
Identify one important challenge, define the KPIs that can help solve it, assess the available data, and build a focused BI solution around that objective. Once the results are clear, the same framework can be expanded to other departments and use cases.
This approach reduces unnecessary complexity and allows teams to learn what works before making a larger investment.
Conclusion
Business intelligence services help organizations move from simply collecting data to actually using it. Through data integration, warehousing, analytics, visualization, dashboards, and reporting, BI creates a clearer picture of business performance.
The strongest BI strategies begin with business goals rather than technology. They use reliable data, relevant KPIs, intuitive reporting, and solutions that can evolve as the organization grows.
As AI, cloud analytics, and self-service BI continue to develop, businesses have more ways to access and understand their data. But the fundamental principle remains unchanged: better data leads to better decisions only when businesses know how to turn that data into meaningful action.
FAQs
What are business intelligence services?
Business intelligence services help organizations collect, integrate, analyze, and visualize business data. They can include BI consulting, data warehousing, data integration, dashboard development, reporting, analytics, implementation, and ongoing support.
Why do businesses need BI services?
Businesses use BI services to gain clearer visibility into performance, identify trends, improve operational efficiency, monitor KPIs, and support data-driven decision-making.
How much do business intelligence services cost?
The cost depends on factors such as project complexity, number of data sources, integrations, users, BI platform, dashboard requirements, data infrastructure, and ongoing support. There is no single price that applies to every BI project.
What is the difference between BI and business analytics?
Business intelligence generally focuses on understanding and monitoring business performance, while business analytics can go further by using statistical and predictive techniques to understand causes, forecast outcomes, and support potential decisions.
Can small businesses use business intelligence?
Yes. Small businesses can use BI to monitor important areas such as sales, marketing, finances, customers, and operations. The solution does not need to be complex; it should match the company’s data, goals, and reporting needs.
🌱 Keep learning. Keep growing. Follow Tech Statar.